
FREE CAYMAN MARKET RESEARCH
Cayman property prices, rents and land from 2017 to 2026, in one report.
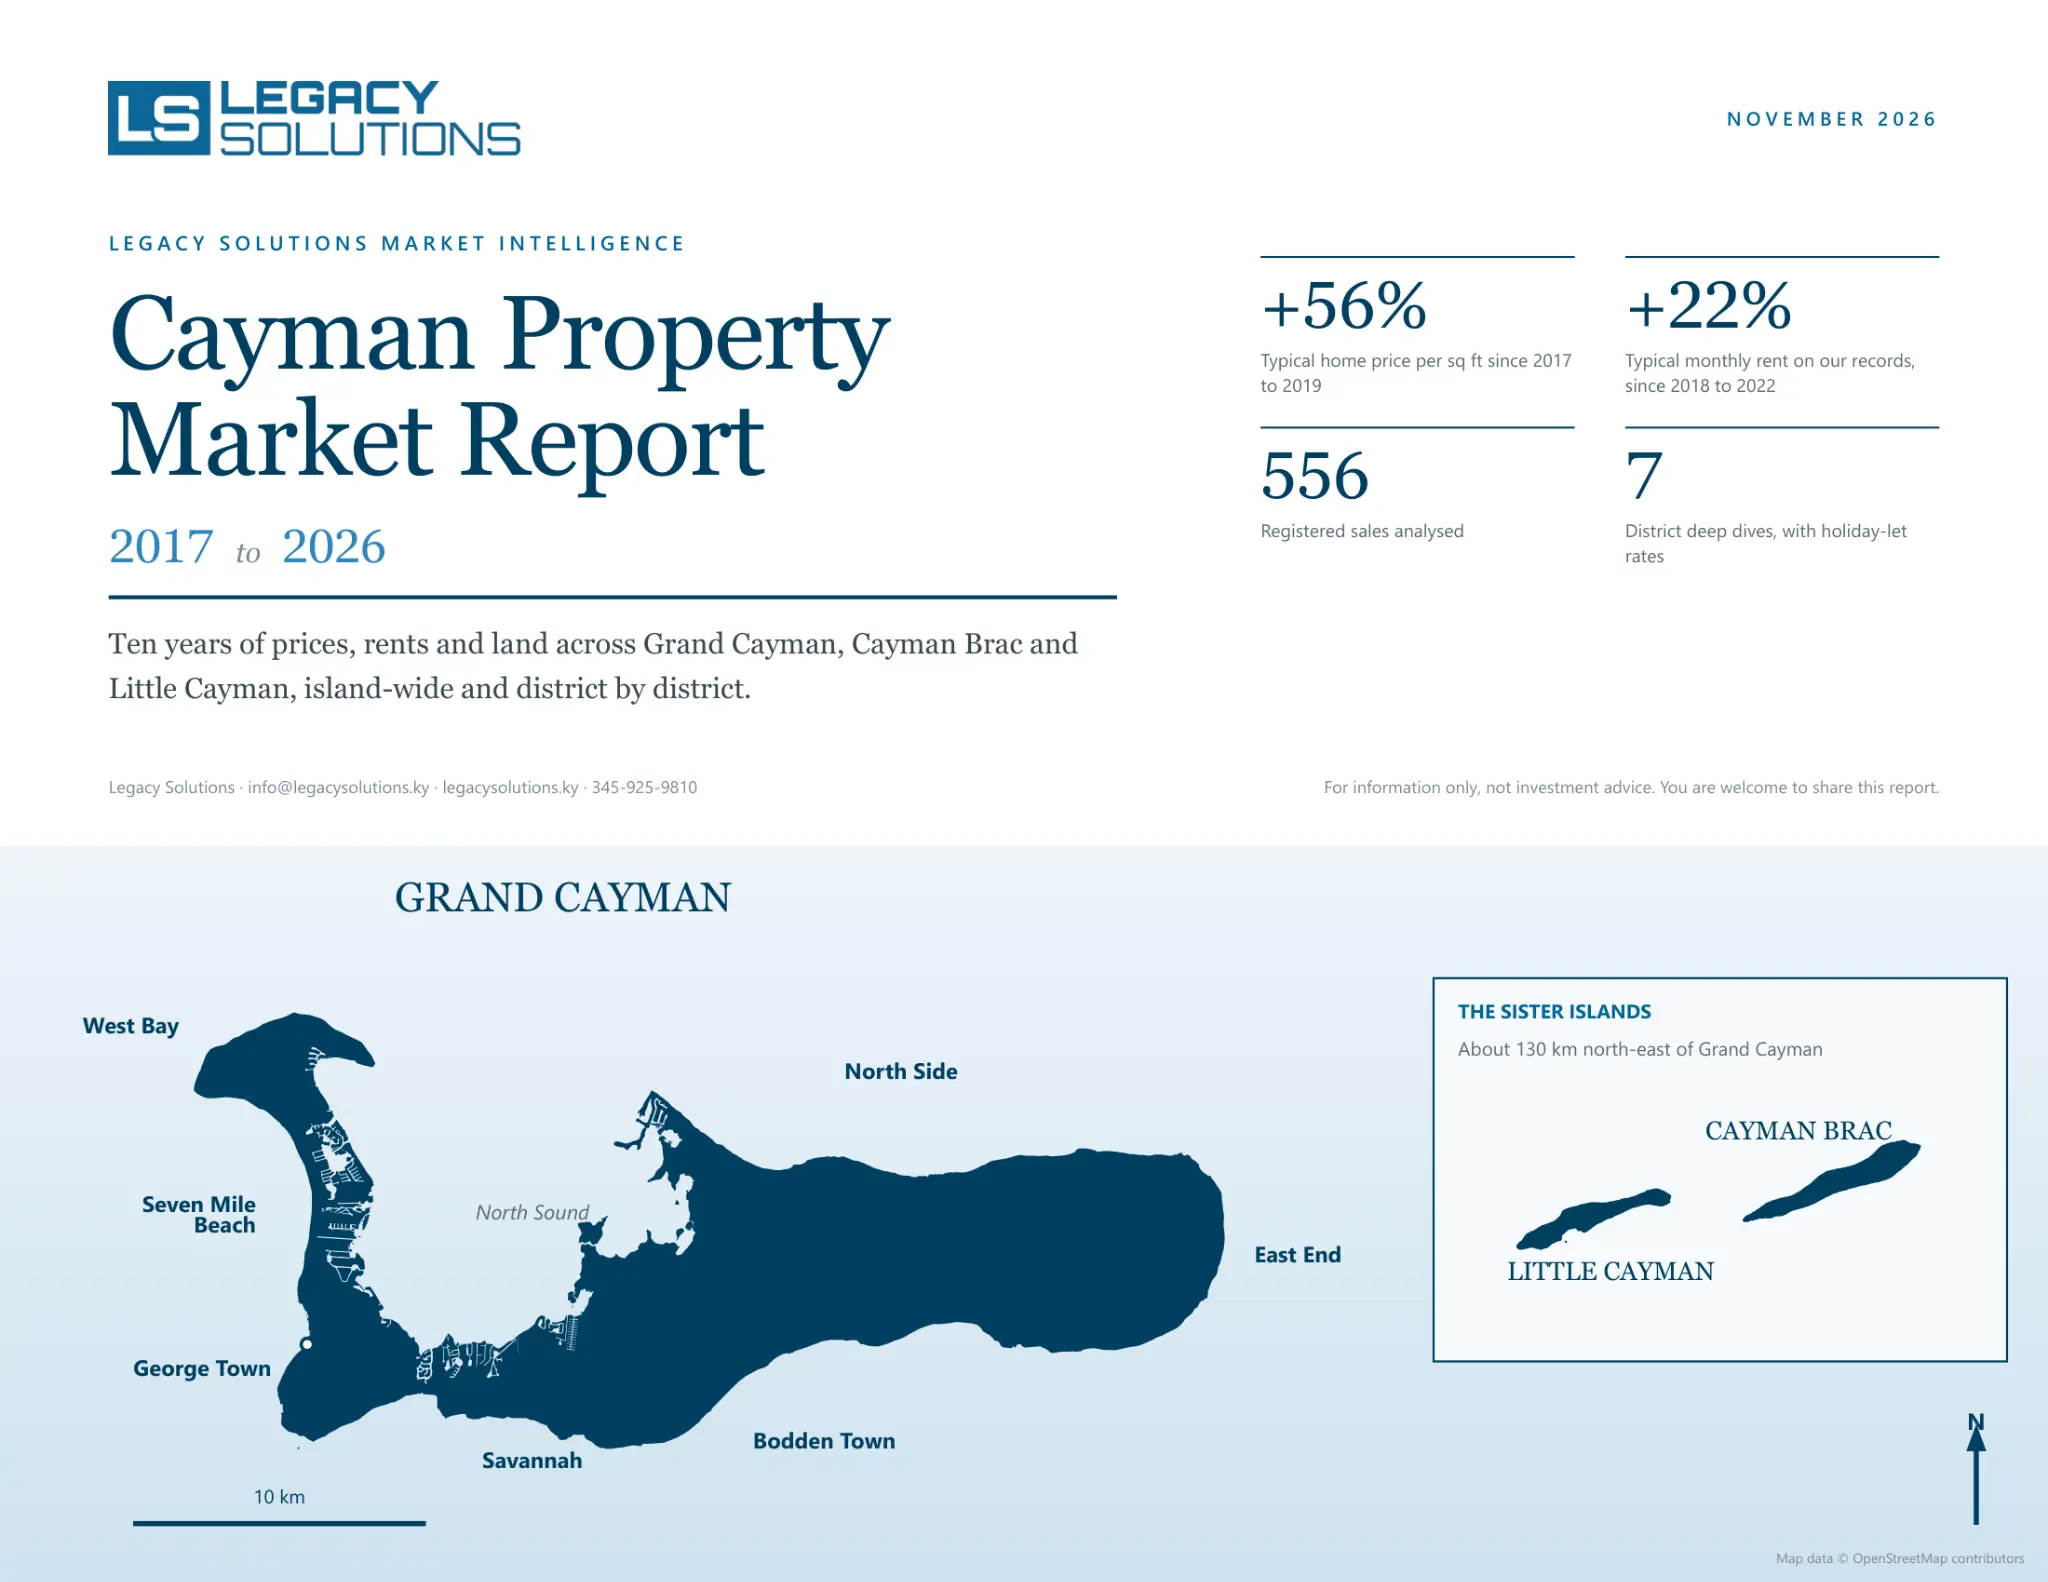
Our Cayman Property Market Report covers 2017 to 2026, island-wide and district by district, with the events behind the numbers: COVID, the interest rate rises and the recent storms.
- +56%
- Typical home price per sq ft since 2017 to 2019
- +22%
- Typical monthly rent since 2018 to 2022, internal database
- 7
- District deep dives, with rents by bedroom
- 34 pages
- Every public source listed, with links
What's inside
- Prices by year, by era and by type of home
- A page on every district, from George Town to the Sister Islands
- Long-term and holiday-let rents by bedroom
- Land values across the islands
- How our figures compare with the published market reports
- What to watch in 2026 and 2027
- An appendix of every public source, with links
For information only, not investment advice. Figures come from public information named in the report and from Legacy Solutions' internal database, which is not public.
Know your numbers before you speak to the bank.
One email a month on the second Tuesday, free: Cayman-focused insights, new resources and early access to workshops.